
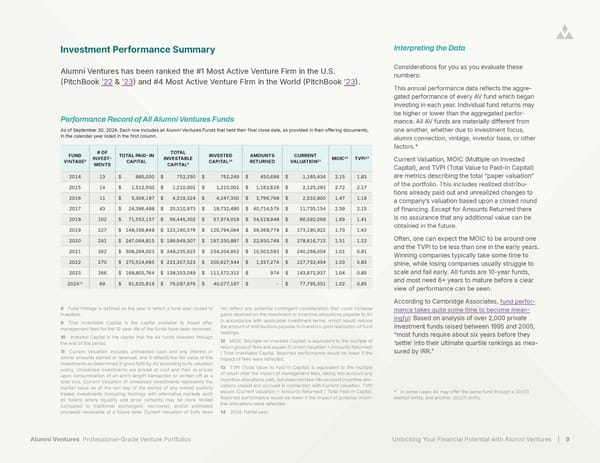
Alumni Ventures Professional-Grade Venture Portfolios Unlocking Your Financial Potential with Alumni Ventures | 9 Investment Performance Summary Alumni Ventures has been ranked the #1 Most Active Venture Firm in the U.S. (PitchBook ’22 & ’23) and #4 Most Active Venture Firm in the World (PitchBook ’23). Performance Record of All Alumni Ventures Funds As of September 30, 2024. Each row includes all Alumni Ventures Funds that held their final close date, as provided in their offering documents, in the calendar year listed in the first column. FUND VINTAGE8 # OF INVEST- MENTS TOTAL PAID-IN CAPITAL TOTAL INVESTABLE CAPITAL9 INVESTED CAPITAL10 AMOUNTS RETURNED CURRENT VALUATION11 MOIC12 TVPI13 2014 13 $ 885,000 $ 752,250 $ 752,249 $ 450,698 $ 1,165,434 2.15 1.83 2015 14 $ 1,512,500 $ 1,210,001 $ 1,210,001 $ 1,162,628 $ 2,125,283 2.72 2.17 2016 11 $ 5,309,187 $ 4,319,324 $ 4,247,350 $ 3,796,768 $ 2,532,800 1.47 1.19 2017 43 $ 24,396,488 $ 20,310,973 $ 19,732,490 $ 40,714,579 $ 11,735,154 2.59 2.15 2018 102 $ 71,553,157 $ 59,445,302 $ 57,974,018 $ 34,018,948 $ 66,592,068 1.69 1.41 2019 227 $ 148,356,848 $ 123,160,379 $ 120,794,094 $ 39,368,778 $ 173,190,822 1.73 1.43 2020 241 $ 247,064,815 $ 199,949,507 $ 197,330,897 $ 22,930,748 $ 278,816,713 1.51 1.22 2021 262 $ 308,294,003 $ 248,235,923 $ 234,204,952 $ 10,503,563 $ 240,268,004 1.01 0.81 2022 270 $ 275,514,685 $ 223,307,523 $ 200,627,544 $ 1,337,274 $ 227,732,454 1.03 0.83 2023 266 $ 168,805,764 $ 138,353,049 $ 111,572,312 $ 974 $ 143,972,937 1.04 0.85 202414 69 $ 91,620,819 $ 76,087,976 $ 40,077,197 $ - $ 77,795,351 1.02 0.85 8 Fund Vintage is defined as the year in which a fund was closed to investors. 9 Total Investable Capital is the capital available to invest after management fees for the 10-year life of the funds have been removed. 10 Invested Capital is the capital that the AV funds invested through the end of the period. 11 Current Valuation includes uninvested cash and any interest or similar amounts earned or received, and it reflects the fair value of the investments as determined in good faith by AV according to its valuation policy. Unrealized investments are priced at cost and then re-priced upon consummation of an arm’s length transaction or written off as a total loss. Current Valuation of unrealized investments represents the market value as of the last day of the period of any owned publicly traded investments (including holdings with alternative markets such as tokens where liquidity and price certainty may be more limited compared to traditional exchanges), escrow(s), and/or estimated proceeds receivable at a future date. Current Valuation of Exits does not reflect any potential contingent consideration that could increase gains received on the investment or incentive allocations payable to AV in accordance with applicable investment terms, which would reduce the amount of distributions payable to investors upon realization of fund holdings. 12 MOIC (Multiple on Invested Capital) is equivalent to the multiple of return gross of fees and equals (Current Valuation + Amounts Returned) / Total Investable Capital. Reported performance would be lower if the impact of fees were reflected. 13 TVPI (Total Value to Paid-In Capital) is equivalent to the multiple of return after the impact of management fees, taking into account any incentive allocations paid, but does not take into account incentive allo- cations unpaid and accrued in connection with Current Valuation. TVPI equals (Current Valuation + Amounts Returned) / Total Paid-In Capital. Reported performance would be lower if the impact of potential incen- tive allocations were reflected. 14 2024: Partial year. Considerations for you as you evaluate these numbers: This annual performance data reflects the aggre- gated performance of every AV fund which began investing in each year. Individual fund returns may be higher or lower than the aggregated perfor- mance. All AV funds are materially different from one another, whether due to investment focus, alumni connection, vintage, investor base, or other factors.* Current Valuation, MOIC (Multiple on Invested Capital), and TVPI (Total Value to Paid-In Capital) are metrics describing the total “paper valuation” of the portfolio. This includes realized distribu- tions already paid out and unrealized changes to a company’s valuation based upon a closed round of financing. Except for Amounts Returned there is no assurance that any additional value can be obtained in the future. Often, one can expect the MOIC to be around one and the TVPI to be less than one in the early years. Winning companies typically take some time to shine, while losing companies usually struggle to scale and fail early. All funds are 10-year funds, and most need 6+ years to mature before a clear view of performance can be seen. According to Cambridge Associates, fund perfor- mance takes quite some time to become mean- ingful: Based on analysis of over 2,000 private investment funds raised between 1995 and 2005, “most funds require about six years before they ‘settle’ into their ultimate quartile rankings as mea- sured by IRR.” Interpreting the Data * In some cases AV may offer the same fund through a 3(c)(1) exempt entity, and another 3(c)(7) entity.
 Unlocking Your Financial Potential With Alumni Ventures Page 8 Page 10